MarketNsight Reports on First Half of 2023
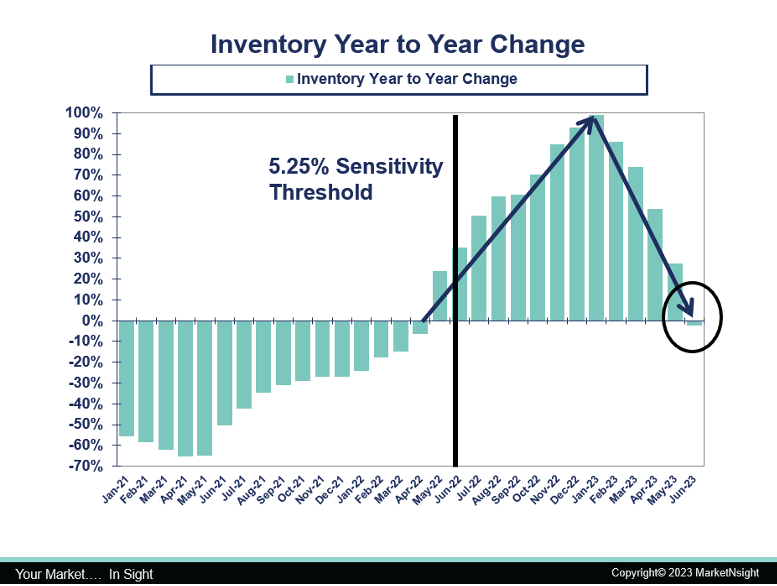
MarketNsight, a leading real estate data and analysis provider, recently revealed housing data through the end of June 2023. Of note, year-to-year housing inventory has collapsed since January and was negative in June for the first time in 13 months. Months of supply (MOS) at the end of June 2023 was 1.8.
According to John Hunt, Principal and Chief Analyst at MarketNsight, inventory reached a significant inflection point in June 2023, signaling lower inventory levels in the future. This can be seen both in month-to-month and year-to-year numbers.

Hunt reiterated, “There was already a housing shortage before the pandemic. The pandemic housing boom made it worse, and the Fed’s actions will only deepen the inventory crisis.”
In April, MarketNsight predicted that MOS would increase in May and June, but MOS would not go higher than 3 for the year. With inventory slowing dramatically, the research company now believes that the MOS for 2023 will peak at 2.5 in October or November.
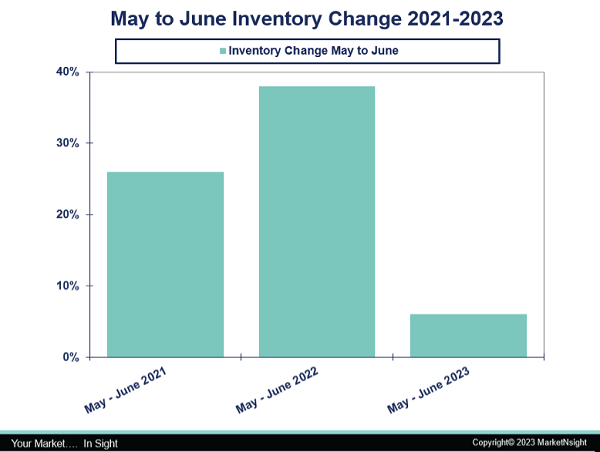
Due to seasonality, inventory typically increases from May to June every year. The May to June increases for 2021 and 2022 were 26% and 38%, respectively. However, inventory from May to June this year was only up 6%, signaling a dramatic shift toward lower inventory levels.

After being negative during the pandemic housing boom, year-to-year inventory turned positive in the summer of 2022 as interest rates crossed the 5.25% Sensitivity Threshold. When measured year over year, inventory rose quickly, peaking in January 2023, which had double the inventory of January 2022. But just as quickly, year-to-year inventory collapsed in the first half of 2023 and was negative in June for the first time in 13 months.
MarketNsight’s forecast for the second half of 2023:
- Overall housing demand is down 19% year-to-year, and we will not see significant improvement until interest rates drop closer to the Sensitivity Threshold of 5.25%.
- Inventory will tighten further in the coming quarters, and we do not have enough supply for existing demand.
- The new home industry is addressing some of the shortages, and as a result, new home market share is increasing dramatically.
- Home prices have remained amazingly stable despite historically high mortgage rates. With the number of houses beginning to tighten again, prices will remain stable and show a slight increase this year.
To learn more or to schedule a demonstration, visit www.MarketNsight.com.
About MarketNsight:
MarketNsight currently serves 40+ cities in nine states – Alabama, Florida, Georgia, Louisiana, North Carolina, South Carolina, Tennessee, Texas and Virginia. Look for the addition of more cities soon!
To schedule a demonstration of the MarketNsight Feasibility Matrix® or Mortgage Matrix®, call 770-419-9891 or email info@MarketNsight.com. For information about MarketNsight and John Hunt's upcoming speaking engagements, visit www.MarketNsight.com.


